Webinar series lays foundation for data processing methods
By D. Scott Sink and Jared Frederici
Industrial engineering has evolved significantly over the past 30-plus years, certainly over the 75 years since IISE, our professional society, was formed in Columbus, Ohio. Measurement and analysis leading to improvement has been the foundation of our profession – time studies on laying foundations and bricks as you recall was an early study by Frank Gilbreth and Frederick Taylor.
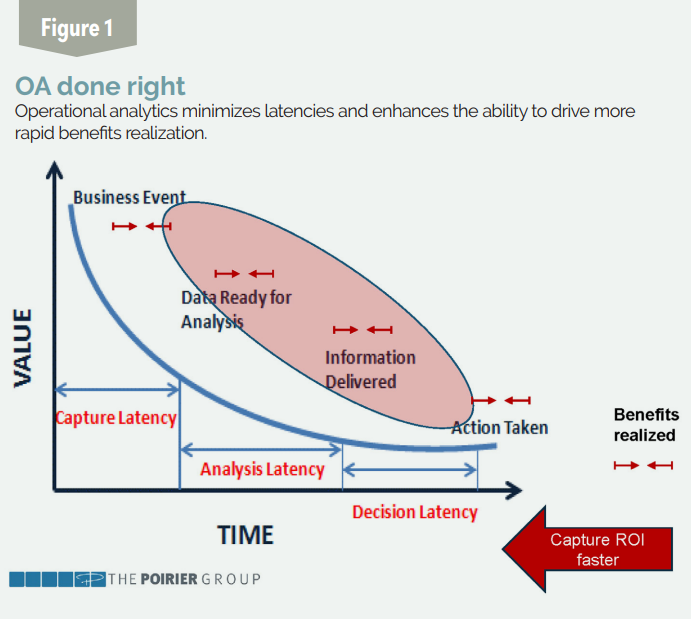
Our ability to capture, store, process and portray data has increased exponentially over time, specifically in the last 20 years. And, with the maturation of artificial intelligence (AI), machine learning, automated data processing and conversion of data to information, decision support and action-taking are amplified and accelerated. The latencies that slow down benefits
realization on “innovation” can be minimized (see Figure 1).
In June and July, our IISE Global Performance Excellence Webinar Program delivered a series of four webinars that laid a foundation for ISEs and others to better understand the subfield of operational analytics within ISE.
This article is an executive summary of that series of webinars. (101, 201, 301 and a 401-Best Practice Case Study from University Health Network in Toronto. It is also an overview of what is taught, in more detail, in IISE’s Operational Analytics Certification Course.
What follows is an executive summary from that miniseries of webinars on operational analytics. Analytics is a huge and growing field that has been fueled by technological advances and enablement. At the recent IISE Annual Conference in New Orleans, keynote speaker Judy Jin, professor of industrial and operations engineering at the University of Michigan,
discussed the interface of data science and quality engineering. I was exposed to the concept of data fusion. I hadn’t thought about the continuum of types of data that can be assembled, integrated and “fused” so that new, improved insights can be created. These are exciting times for ISEs and those who thrive on information and decision-to-action support systems.
We’ve all heard about “Big Data” and most of us generally understand what that means – we have more data. The 10 technology laws, specifically Gordon Moore’s and Robert Metcalfe’s, are driving the rapid evolution of analytics. We have more data from more sources and we can store that data efficiently (at essentially zero cost) and can transmit more data faster (essentially at zero incremental cost). Hence the network of users is growing faster. This coupled with application and power tools’ rapid developments create a great deal of complexity for
professionals and users. And this has created challenging strategy choices and decisions in major industries and organizations for the past 10-20 years. For interesting examples, you might enjoy Good Strategy Bad Strategy by Richard Rumelt.
Typologies for analytics
Lots of data, big/little data, good/poor data, structured/semi-structured/unstructured data, data rich/information poor – there are many ways to classify types of analytic situations, as well as types of analytics. Our focus is on how we can improve our ability to better use data and facts to drive benefits faster in operations. What we know and have experienced in the world of “operations” (very broadly defined) is that:
• Most organizations are either data poor or they are data rich and information poor.
• Most “professionals” who are involved with analytics, management, performance management and
improvement are not well-prepared (trained or skilled) to make good use of the data and facts available to them.
• Rapidly emerging tools, for example in the MS365 suite of apps (Sharepoint, Dynamics, Power BI), are catalyzing progress with data/fact utilization to support decisions and actions and improvement.
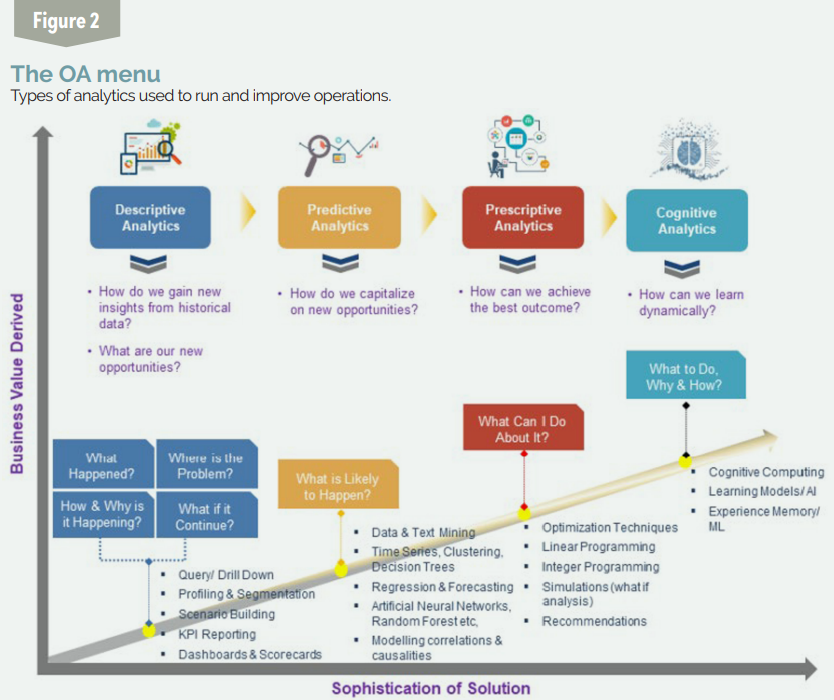
The graphic in Figure 2 portrays the types of analytics that can and are being used to run and improve operations. My experience is that there is much room for improvement just with descriptive (exploratory and confirmatory) analytics. Our ability to use the data we have the way W. Edwards Deming and others demonstrated 30 years ago is still underdeveloped. Being good at descriptive analytics is a precondition for being able to understand and move into more sophisticated analytics, e.g., predictive, prescriptive and then into cognitive analysis (double and triple loop learning). Just improving your organizations to do process improvement projects (e.g., DMAIC) and utilize data and facts can be a great starting point.
The road to great measurement and analytics systems will be a reasonable journey and require some patience and planning. It will require approaching growing data science, measurement and evaluation and analytics capabilities using a systematic design approach.
In our miniseries, we chose to adopt a design for quality, utility, profitability, optionality, etc., approach, followed the DCDOV (define, concept design, detailed design and development, optimize, verify) roadmap.
Operational Analytics 101
Define: Foundations for building (creating) improved performance measurement, analysis/evaluation, improvement systems
Operational analytics is actually embedded in management systems engineering, the engineering
of management systems, and is one of the four legs of the ISE “stool” – operations research, human factors engineering, and manufacturing and production systems engineering are the other three.
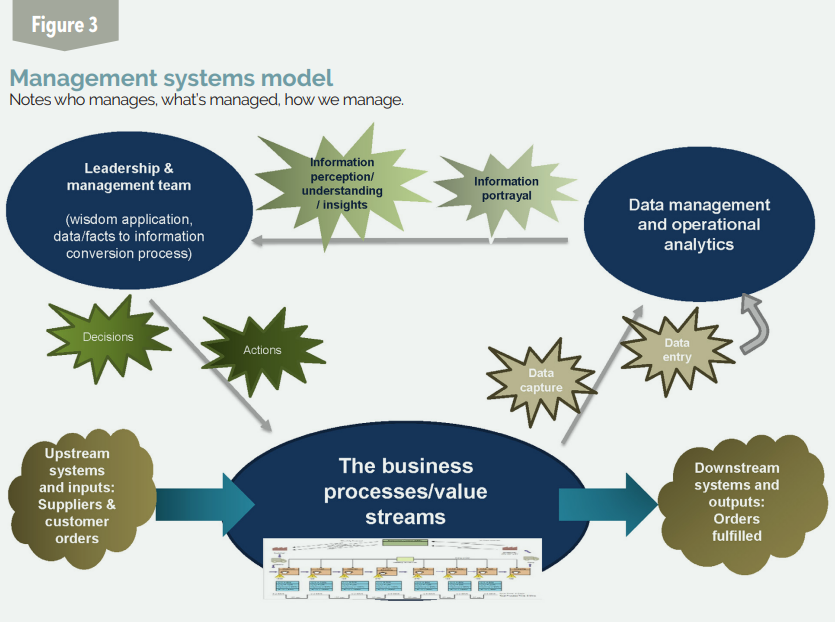
The focus in our OA 101 session was on introducing the management systems model and management systems analysis as the core framework for understanding the roadmap (strategy path) to doing a better job with measurement and analytics. The management systems engineering model or framework in Figure 3 was introduced and explained.
The management systems engineering approach, using the model as a roadmap, requires that you address a number of fundamental questions:
What’s being managed, what needs improvement and why? The focus is on the manageable units in
“operations,” enterprises and organizational systems, which are business processes, value streams and processes.
How does it and should it work? The “it” means the “system,” unit of analysis that you are working to improve. Apply workflow, process, value stream characterization methods and tools to create a shared understanding of the future state and current state.
How does it perform; how should it be performing? Apply statistical thinking, understand process capability, break out of snapshot comparisons, build and utilize longitudinal data. Understand spec limits and learn to develop them rationally.
Improve performance systematically, rationally and with discipline. From a systems thinking perspective, what are the right “levers” (factors) that we need to change in order to cause the process to improve and perform, consistently and sustainably, the way we (our customers) need it to? By what method?
Continually work to optimize the process, verify that the right benefits are being created and that enterprise value is being positively impacted. Tiered scorecards and dashboards reveal causal connections from improvement initiatives to business and customer(supplier, employee, other stakeholders) value.
Our focus in 101 was singularly on creating an understanding of how to use the management systems model as a guide, a roadmap for ensuring that your performance measurement work has context, is systematic and ultimately will be successful in driving improved enterprise value.
Operational Analytics 201
Concept design: Introducing the operational analytics ‘triangle’ framework
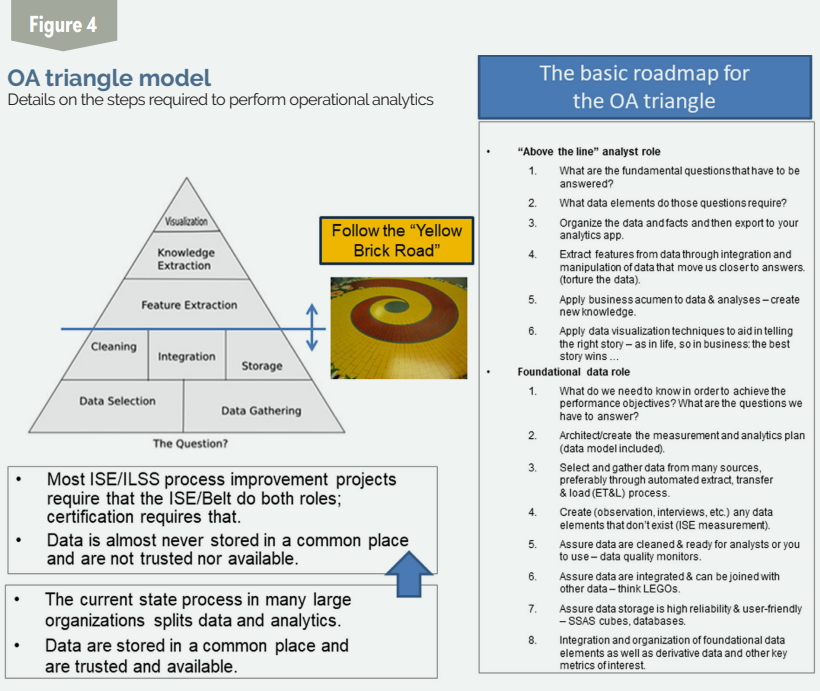
The focus of our second session was on introducing what I call the operational analytics triangle as the second, complementary framework/model to aid your understanding of operational analytics. It is a model introduced to me by the global supply chain group for Intel at our fall 2016 Council on Industrial and Systems Engineering (CISE) meeting in Phoenix. It’s fundamental and basic, yet also provides insights and understanding about the steps required to “do” operational analytics in the context of management systems engineering work. (see Figure 4)
The model depicts high level steps and tasks required for what is called the “data management” role and then for the “analyst” role. Note that at the base of the triangle are the words “the questions.” All analytics work begins with a use case, a user or set of users (customer); a purpose, intent or desired outcome that is aligned to strategy; and a need for information to support decisions, actions or investments, etc. One of the biggest mistakes analysts often make is to do analytics in the absence of understanding the purpose, intent, need, requirements and, most of all, before thinking through the “measure what matters” question.
Much operational analytics work requires that people be able to do both roles – the bottom half of triangle work as well as the top half. ISEs most often find this to be the case. We often have support from IT for the data management work but ultimately have to “do it all,” which is part of the challenge with OA.
The bottom half (below the line), foundational data role quite often involves tapping into enterprise resource planning (ERP) systems and other functional databases, SQL servers, etc. Understanding what data is available, where it’s stored, how to get access and do extracts is all part of the role of the data manager. My experience, from an “operations” perspective, is that understanding what data elements you need, having a “data model” thought through and built, is the step that is often missed completely or done poorly or inadequately.
We discussed in the webinar the general principles and approach to creating a quality data model to support your analytics work.The context for analytics work, torturing data, slicing and dicing, data munging and wrangling must be well understood to ensure that analytics isn’t just an endless do-loop of report and chart creation. So much work today ends up just creating a bunch of charts – graphs that are “so what’s” to those leading and managing. It’s so easy to lose sight of the forest for the trees in the analytics methodology we outline in the triangle. Getting the concept design done properly can avoid what is called the “muddle in the middle” phenomenon.
The analytics triangle, the basic steps in analytics, must be done in the context of your larger management systems engineering work. Following the “yellow brick road,” the path we outline can lead to visualizations that create insights, cause “aha” moments, and truly provoke more timely decisions and actions that are causally connected to enterprise value.
But just being good with Power BI, for example, and being able to create reports, dashboards and scorecards, while necessary for success, isn’t sufficient for success. We have to build larger systems that visibility components fit into and connect with the people who are leading, managing and doing the work itself.
Operational Analytics 301
Detailed design and development
The integration of components of a management system that is built to drive PDSA (plan, do, study, adjust) faster and better was the focus of our third webinar in the series. Better operational analytics, in and of itself, is necessary but not sufficient to reduce latencies and drive benefits realization on improvement initiatives that ultimately grow
enterprise value. Better operational analytics fits into a larger improvement system in an organization. The key components of that improvement system are:
A business process improvement team or function that reports to the top team. There needs to be a skilled team leading the design, development, deployment and evolution of the improvement system. Think of this group as the architect and engineering team but also the construction team, as well as the operations team. This is a small group of highly skilled professionals that will drive management systems engineering, supported with operational analytics, to systematically grow enterprise value on behalf of the leadership team.
Management system modelling, management system analysis. Which system, business process or process am I focused on and why/how does it work? (How does it need to work?) How does it perform? (How does it need to perform?) What are the ‘levers’ for improvement? Push those levers; are they working? Do it again.
Operational analytics triangle. Create visibility, visible measurement systems, operational/practical/useful-used scorecards and dashboards to support a sustainable understanding of how “it” is performing over time.
• Build an op analytics sub-team in the BPI group to lead the promulgation and expansion of best-in-class op analytics to drive innovation and improvement.
• Develop the skill sets to masterfully navigate the OA roadmap outlined in Figure 2.
Develop PDSA systems. Find natural mechanisms, ways to create more:
• Engagement
• Visibility
• Understanding and alignment
• Accountability
• Communication and coordination (cross-functionally, end2end in value streams)
• Discipline
Examples of this are huddles/retrospectives; tiered huddle systems; enterprisewide top-to-bottom planning systems with coordinated deployment (e.g., Hoshin Kanri), and many more.
Operational Analytics 401
Best practice case study(ies)
We showcased the analytics work being done at the University Health Network in Toronto in the fourth webinar of the series. The aim was to provide a great example of some outstanding analytics developments. There are many organizations that are excelling in this domain. The ones that stand out for me are:
Glimpses of the emerging future state for both preparing analytics professionals and reducing this all to practice.
• Dalhousie’s industrial engineering plan of study, BSIE. I think its curriculum is aligned very well with the changing needs and requirements of the industry from an analytics perspective, in particular.
• Northwestern’s MS in Analytics is housed within the Department of Industrial Engineering and
Management Sciences. I was and continue to be impressed with that advanced degree in analytics.
• Intel’s global supply chain efforts led by Sean Cunningham. Sean’s presentation to CISE in 2013 was superb. I know that they have only gotten better at their approach to management systems engineering and operational analytics.
• UHN Toronto, our featured Best Practice Webinar.
• Call to action: What are some of your favorite programs
in improvement systems that are data/fact/analytics/based? Reach out to me and share at
ssink@jumpcurves.com.
The current state for “most?”
As I reflect back on the 250 projects I coached from 2007-2020 in a wide variety of organizations, these things stand out as “needs improvement” or gaps to close as related to their capabilities and competencies to systematically drive improvement leveraging data, facts and solid analytics:
• There was no leadership for coordinated improvement; hence improvement efforts were like patches of a patchwork quilt, with no one to put the integrated quilt together, no concerted effort.
• There was no “profound knowledge” – no op ex, op analytics specialist/leader who could provide guidance and a consistent plan of action.
• People doing the work were hungry for data and facts. They wanted to know how they were doing; when visibility was provided it motivated and actually improved and lifted performance.
• The concepts of flow and Lean were largely unknown, with low to no awareness about these principles.
• When data analysis was provided, it often was low to no value, wasn’t the right information or not timely, or not portrayed in a way that was digestible.
• There is a preponderance of single data point or snapshot-in-time thinking when analyzing a situation, even after 30 years, Deming’s call for “statistical thinking” goes unheeded. Creative tension arises when you put the future state characterization juxtaposition with the current state reality. So when I do that with the best practice examples I’m familiar with and compare and contrast to many of my experiences with the Ohio State ISE Capstone sponsors, I envision migration plans that look exactly like what was shared by Michael Caesar and Andre D’Penha from UHN in our July webinar. See highlights iise.org/details.
Best practices closing the gaps.
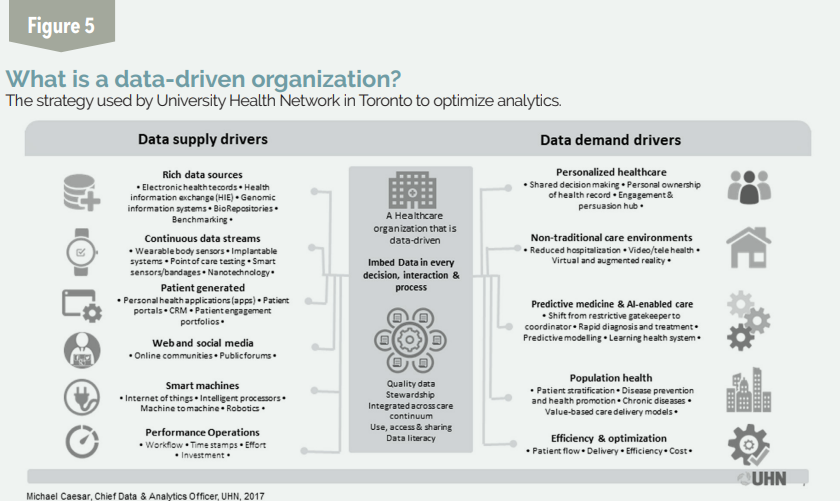
I was first introduced to UHN’s program in fall 2017 at our CISE meeting in Toronto. I was immediately struck by the quality of the strategy for how data science was being built out at UHN. The update we provided in July confirmed my sense that this is a built-to-last great example of how to systematically build an organizational/operational excellence program that is founded in a reliance on data and facts.
It starts with the work being solidly grounded in the organization’s vision and strategy, and as Michael and Andre shared, that is clearly the case for data strategy, governance and analytics. The initiative is well-positioned and clearly an integral component of the organization’s larger strategy for the future. Then it requires a well-thought-through strategy for how to become a data-driven organization (see Figure 5, Page 40). The roadmap, a strategy path that was shared, makes sense; it’s clear, logical and sound. The end game is clearly articulated as “create value;” the means doesn’t get confused with the end. I recommend the 401 webinar. I feel like it was a fitting capstone to the three foundation webinars we provided – an outstanding real-world example of the messages, principles and methods shared in 101-301.
Key points, next steps to consider I will end with six key points (thanks to Sean Cunningham
from Intel for creating the original list I have tweaked over the past five years):
• Good analytics come from good context understanding – use case clarity, good problem
statements, clear understanding of “done,” what information is required and why.
• Some people have all the skills required for good operational analytics – business acumen, data management, analytics, decision and action support – to perform solid operational analytics. But it is a slow craft development process for most.
• Investment in the right data foundation has a positive ROI, as analysts can help leaders and managers move faster when data is trusted, resulting in faster benefits realization and growth in enterprise value.
• Good data visualizations can tell the right story quickly because people are predisposed to believe what they can see and quickly grasp.
• There is a very positive ROI that comes from getting operational analytics well designed and developed (engineered); small analytics teams can wield disproportionate influence on the bottom line.
• Good operational analytics provokes more timely decisions and actions. And simple and persuasive/influential beats complex/ambiguous every time. I encourage you to take the time to view the four webinars, if you haven’t already. And I invite you to consider IISE’s Operational Analytics Certification Course (link.iise.org/oao) for yourself or members of your team.
We can help you start to create a team of enlightened analysts who can shape and build a better data-driven organization. We can tailor the course to meet the practical needs of the person enrolled; for an in-house course, with hybrid/blended training; and create tailored,
customized material for you to use in-house. Look for our upcoming modules, 501 and 601 where
we will start to drill down into specific tools, such as:
• Power BI.
• Scorecard and dashboard development.
• Huddle boards development.
• Tiered huddle design and development.
• Advanced data collection and integration tools/apps.