The Poirier Group specializes in driving large-scale transformations that create business agility through disruption. This paper will rely on a case study from a recent project in the home improvement sector that focused on improving product and service quality to drive value to the bottom line. These insights are designed to be flexible and industry-agnostic. Read on to learn more about:
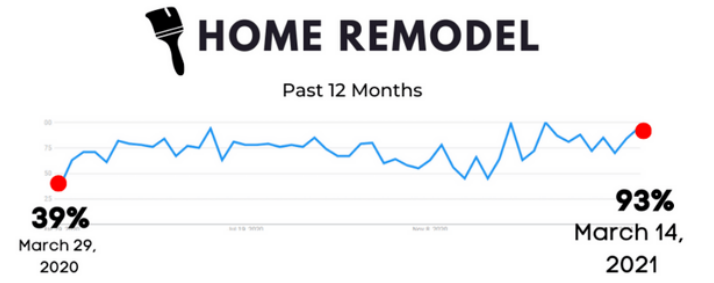
When the COVID-19 pandemic hit, home improvement companies found themselves unprepared for an unprecedented spike in demand. Several retailers placed commissioned workers on furlough in anticipation of declined sales. When sales skyrocketed instead, retailers found themselves in the unenviable position of competing against other industries for their previous personnel who had secured other roles in the interim with increased salaries, benefits, and perks. Retailers also saw a major shift in the type of products and services customers wanted to purchase in the home improvement space.
As this change in consumer demand became evident (particularly within the important Millennial segment), traditional furniture retailers scrambled to improve their sales processes and order fulfillment times to grow their businesses. The Poirier Group was engaged to help home furnishing businesses scale their operations to support future growth. Our simplified and forward-thinking approach enabled our clients to be resilient and agile in the face of unprecedented disruptions and change. A company’s inability to handle sales leads within a 4–24-hour window is an early indicator that a business is unable to scale their businesses to meet demand. During the early stages of many companies’ pandemic response, customers experienced wait times of up to one month before a sales representative reached out to discuss their needs. This resulted in high levels of customer dissatisfaction and customer attrition. Unfortunately, companies that were not agile saw their processes break under the weight of this increased demand with negative consequences to their operations, growth, and reputation.
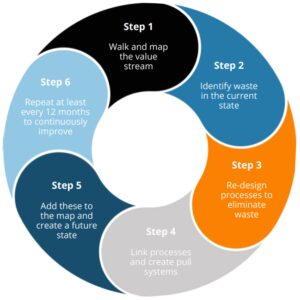
The first stage of our engagement with our clients usually starts with the creation of value-stream maps of their product development systems. Value-stream mapping is an invaluable tool which allows us to quickly and effectively pinpoint waste in our clients’ processes. To identify waste in business processes, we look at the existing business processes through the lens of the customer. If the answer to this is no, then that process step is identified as waste and needs to be eliminated. We then quantify the cost of that waste and create process improvement initiatives to eliminate the cost of poor quality (COPQ) in future-state process cycles. This simple step of eliminating waste in the process can save an organization millions of dollars and build significant process capacity to generate more sales. Many of us are familiar with the image of an iceberg floating in the ocean and are in awe of its large expanse above the water. However, the real risk the iceberg poses is contained below its waterline, the parts unseen which often constitute more than 80% of its actual mass. So how do we navigate a business to avoid the unseen perils associated with the cost of waste iceberg?
The first stage of our engagement with our clients usually starts with the creation of value-stream maps of their product development systems. Value-stream mapping is an invaluable tool which allows us to quickly and effectively pinpoint waste in our clients’ processes. To identify waste in business processes, we look at the existing business processes through the lens of the customer. If the answer to this is no, then that process step is identified as waste and needs to be eliminated. We then quantify the cost of that waste and create process improvement initiatives to eliminate the cost of poor quality (COPQ) in future-state process cycles. This simple step of eliminating waste in the process can save an organization millions of dollars and build significant process capacity to generate more sales. Many of us are familiar with the image of an iceberg floating in the ocean and are in awe of its large expanse above the water. However, the real risk the iceberg poses is contained below its waterline, the parts unseen which often constitute more than 80% of its actual mass. So how do we navigate a business to avoid the unseen perils associated with the cost of waste iceberg?
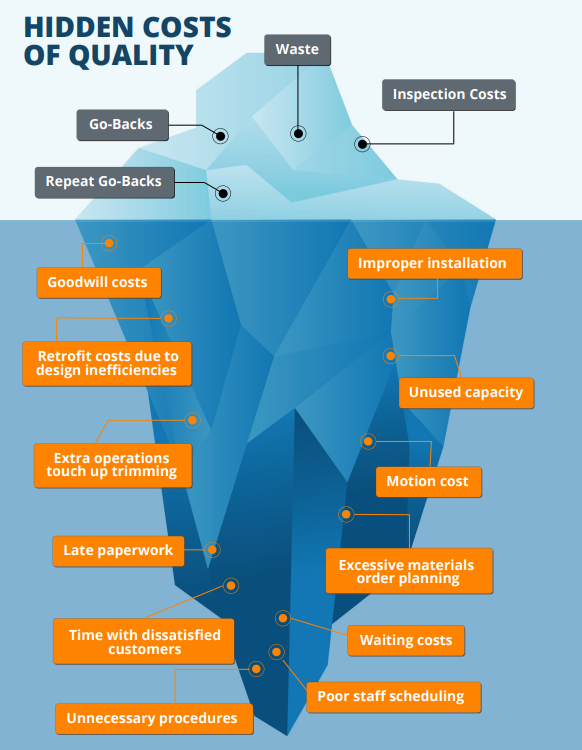
Start with identifying and controlling what is above the waterline – unnecessary rework, scrap, inspections to prevent defect leakage and extra processing. In Lean methodology, rework, inspection and extra processing are known as “waste” in the process. They do not deliver end-value to the customer and interrupt efficient process flow. If you do not take action to eliminate these, they will erode a business’s gross profit margins by upwards of 20-30% and also place a stranglehold on its opportunity costs.
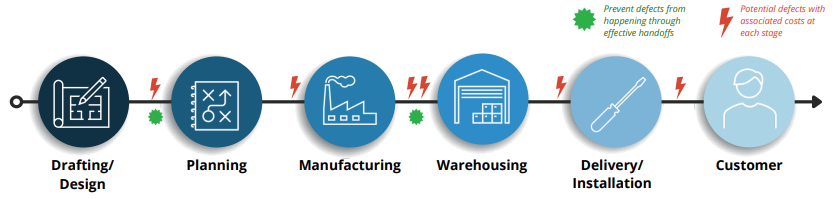
Consider a high-end custom manufacturer in North America. This manufacturer builds, delivers and installs custom home furnishings for its clients. As part of its high-touch process, prospective customers receive design consultations with a Designer who configures and creates a design blueprint for their new space.
When you add the multiplier effect of increased customer handling costs and reduced resource capacity, this cost grows exponentially! In this case study, an average cost to tear out incorrectly installed furnishings can reach up to $25,000, depending on percentage installed. Multiply this by 100 occurrences and you have $250,000 in wasted materials and resources! If we extrapolate further, a furniture manufacturer who installs 20,000 custom spaces, with an error rate of 15% at an average a cost of $5400 to repair, will experience $16+ million in waste and a significant erosion of their bottom line.
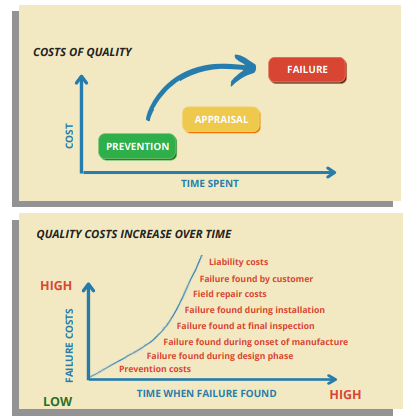
A defect is defined as a “failure to meet one of the acceptance criteria of your customers.” When the customer expects the flawless design and installation of a custom home furnishing, any measurement error that impacts that flawless execution in their home space (i.e., the wrong measurement for a door which will not close properly), is classified as a defect. Each defect has a cost assigned to it based on where it is detected in the value chain. The further along the value chain the defect “leaks”, the more expensive it becomes to rectify. Also, the further along the value chain the defect escapes, the greater
the likelihood of customer dissatisfaction and attrition from your brand. In short, when defects are caught too late, serious costs are associated. Most companies are unaware of the volume of their defects as well as the location of defects in their value chain. The first step toward identifying and eliminating these defects is to create a defect classification system and robust data collection plan to record the errors and assign a cost of waste. Classifications can be defined as follows:
TIPS FOR SUCCES: To identify and eliminate defects, it is important to create a robust data collection plan and classification system to record defects and assign a cost of waste.
It is evident that cost and customer satisfaction are both impacted by the criticality of the defect. From the customer lens, these defects are particularly apparent and impact existing and new customers’ perceptions of a brand. The Cost of Waste assigned to these defects among others can include inspection costs, adjustment/ repair costs, re-order costs, increased customer handling costs and discounts. A robust data collection plan is necessary to ensure that defects are captured both accurately and in real-time. Priority is given to the detection of critical and major defects based on their impact on the customer and the brand. Root cause analysis and escalation protocols should be implemented to ensure the timely resolution of issues and to prevent future occurrences.
TIPS FOR SUCCES: Use technology enablement to ensure effective process handoffs. Intelligent Process Automation can detect processing errors and reroute them to their point of origination for correction, eliminating the need for costly and time-consuming inspection processes. Use a Visual Management Board or technology enablement (i.e., Kanban Boards) to record defects and their progress through the value chain. Improvement efforts should be focused on frequently occurring defects and those that have a critical impact to customer safety, brand reputation or profitability.
Another deadly waste above the waterline on our iceberg is extra processing. Extra processing refers to doing more work, adding more components, or having more steps in a product or service than what the customer requires. This includes incorporating needless complexity in product designs and having more product functionality than was warranted by customer demand. Counter extra processing by understanding and re-designing workflows from the customer’s standpoint.
TIPS FOR SUCCES: To reduce extra processing, simplify the complex!
Root Causes of Complexity
Root Causes of Unnecessary Rework
Examples of these shadowy dangers that lurk below the iceberg waterline include undetected time spent waiting for
the next step in the process flow to occur.
Mapping out current processes captures the natural sequence of the previous activities listed, highlighting bottlenecks, clustered decision-making points, redundant steps, and ineffective checkpoints. These non-value-added steps can be eliminated through countermeasures:
TPG recommends the following strategies to help furniture retailers utilize their employees more efficiently and to create more capable management and hiring practices, therefore righting sizing the company for future growth. This focuses on the factors that contribute to higher employee satisfaction and reduce employee attrition rates.
Realign Accountabilities
The first step in optimizing staffing levels involves realigning department accountabilities within the organization. A responsibility assignment chart maps out every task, milestone or key decision involved in completing a process and provides a comprehensive visualization of who does what in each process. A common model is an R-Matrix. Benefits of an R-Matrix:
Revenue Band Model
Right-size your organization to ensure business agility and resilience during change. The Revenue Band Model is a tool which an organization can use to understand current and predict future headcount requirements. It enables us to:
Talent Assessment Tool
A Talent Assessment Tool helps creates more capable management and hiring practices. It is a tool to map required and desired skills for a team or organization. It is a grid that visualizes the required and available skills and competencies in a team. This makes it an essential tool for any data-driven HR organization. A completed Talent Assessment visualizes the skills that are required, those that are available in the team, and those that the team is missing.
RISKS TO AVOID: Lack of successful staffing and scheduling procedures is one of the largest single factors of poor quality, with a detrimental impact on gross profit margins, employee productivity and overall quality performance. Through the implementation of technology-enabled scheduling and capacity planning models, we can increase capacity up to 20%.
Workflow optimization refers to the process of streamlining a team’s workflows by utilizing technology so workers can complete more work more efficiently and cost-effectively. As a result of workflow optimization, organizations realize quicker operational processes, reduced errors, and decreased resource wastage.
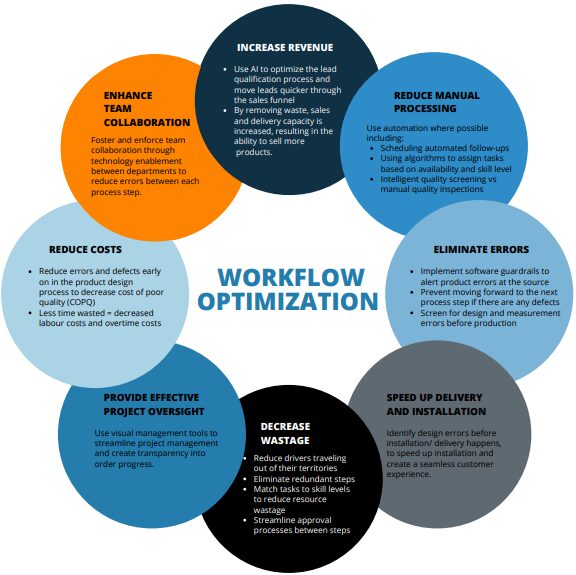
In conclusion, optimized workflows can be designed to eliminate waste across multiple steps of the design-to-delivery process including:
Bottom line — start your enterprise lean transformation today to realize cost savings, improve brand reputation, increase employee capacity and reduce poor quality.