Benchmarking Tool

Welcome to our Benchmarking page, which demonstrates The Poirier Group’s ability to empower you with insightful data to drive business decisions.

If you are interested in more detailed benchmarking with access to over 120 operational and financial metrics, Contact Us to learn more about what TPG can offer your business.


The Poirier Group | Benchmarking Tool
KPI Benchmarking
Explore a small sample of our in-depth operational metrics and potential solutions to help your business improve its performance.
Choose Your Benchmark:
Cases Per Hour
Order Fill Rate
Cost Per Case
Average Outbound Cube
Inventory Turnover
Cases Per Hour
Locked Benchmark
The Poirier Group | Benchmarking Tool
About

Our Definition: The average number of cases processed over one hour across the warehouse (picking, packing, inbound/outbound).

Why is this important? Cases Per Hour is a key warehousing metric that measures the efficiency and productivity of an operation and serves as a crucial indicator of operational throughput. A low level of Cases Per Hour could indicate operational issues in your warehouse processes.

The Poirier Group | Benchmarking Tool
Industry Standard
Average
90.3
cases per hour
  • CPH varies significantly depending on several factors: type of warehousing operation, the product line complexity, and automation.
  • Manual picking operations in traditional warehouse settings often average between 60 to 80 cases per hour per worker.
  • In automated environments (e.g., pick-to-light, robotics), this figure can exceed 200 cases per hour.
The Poirier Group | Benchmarking Tool
Common Warehouse Efficiency Challenges and Potential Solutions
Explore common pain points we’ve heard from our clients and how we have helped them increase their efficiency:
The Poirier Group | Benchmarking Tool
Order Fulfillment Time is Excessively Long, Affecting Customer Satisfaction
How TPG Can Solve
The Poirier Group | Benchmarking Tool
The Poirier Group | SOP Consulting Services
Standard Operating Procedures (SOPs)
Documenting SOPs can assist in making process performance consistent and repeatable, reducing the variance in fulfillment times.
The Poirier Group | Warehouse Optimization
Warehouse Management Systems (WMS)
A WMS optimizes order fulfillment time by providing real-time inventory visibility, streamlining picking and packing processes, enhancing warehouse efficiency.
The Poirier Group | Benchmarking Tool
Inventory Accuracy Problems are Leading to Picking Errors and Delays
How TPG Can Solve
The Poirier Group | Benchmarking Tool
The Poirier Group | Warehouse Optimization
Warehouse Management Systems (WMS)
A WMS reduces inventory inaccuracies by offering real-time tracking, automated data capture, and precise inventory counts, ensuring that stock levels and locations are consistently up-to-date and accurate
The Poirier Group | Inventory Management
Open-To-Buy (OTB) Management
Open-to-buy inventory management reduces inventory inaccuracy by implementing planned purchasing and replenishment strategies aligned with sales forecasts and budget constraints, ensuring appropriate stock levels.
The Poirier Group | Benchmarking Tool
Space Constraints and Warehouse Congestion Hinder Efficient Operations
How TPG Can Solve
The Poirier Group | Benchmarking Tool
The Poirier Group | Inventory Management
Advanced Forecasting
Using inventory management strategies, such as just-in-time (JIT) delivery and advanced demand forecasting, warehousing facilities can maintain optimal inventory levels that align with sales demands, preventing overcrowding.
The Poirier Group | Warehouse Optimization
Optimize Warehouse Design
Warehouses can be redesigned for peak efficiency given the limted space available. TPG’s warehouse management consultants conduct a comprehensive assessment to provide the best path forward for redesigning your warehousing facilities.
Cases Per Hour
160
140
120
100
80
60
40
20
The Poirier Group | Benchmarking Tool
Maximum: 54.6
Median: 90.3
75th Percentile: 115.2
25th Percentile: 76.6
Minimum: 27.4
The Poirier Group | Benchmarking Tool
Industry Benchmarking Data
The Poirier Group | Benchmarking Tool
Industry at a Glance
Explore a sample of our high-level industry metrics across Canada and the USA to contextualize your business within the market.
Warehousing at a Glance
High Level Statistics
Data Sourced as of January 2025
Total Revenue
C$2.3bn
The Poirier Group | Benchmarking Tool
3.3%
2025-29
Total Employees
16.9k
The Poirier Group | Benchmarking Tool
5.3%
2025-29
Number of Businesses
1,798
The Poirier Group | Benchmarking Tool
0.6%
2025-29
Profit Margin
7.1%
The Poirier Group | Benchmarking Tool
0.14%
2025-29
Average Industry Cost Structure
Data Sourced as of January 2025
The Poirier Group | Benchmarking Tool
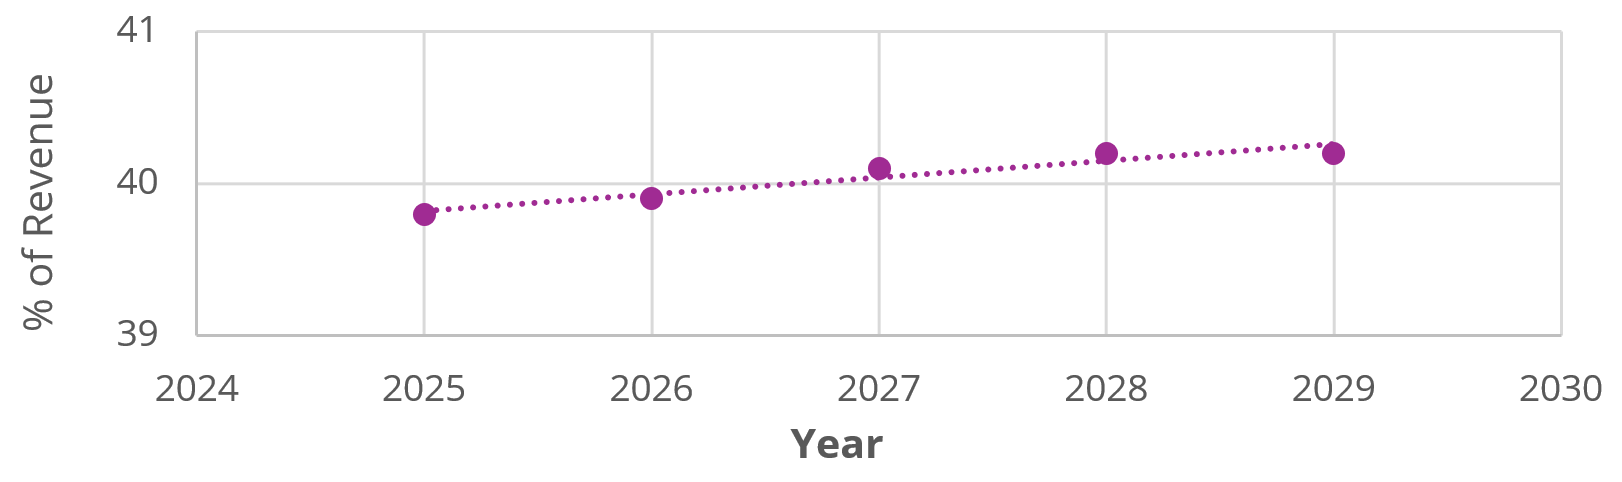
Wages as a Share of Revenue
The Poirier Group | Benchmarking Tool
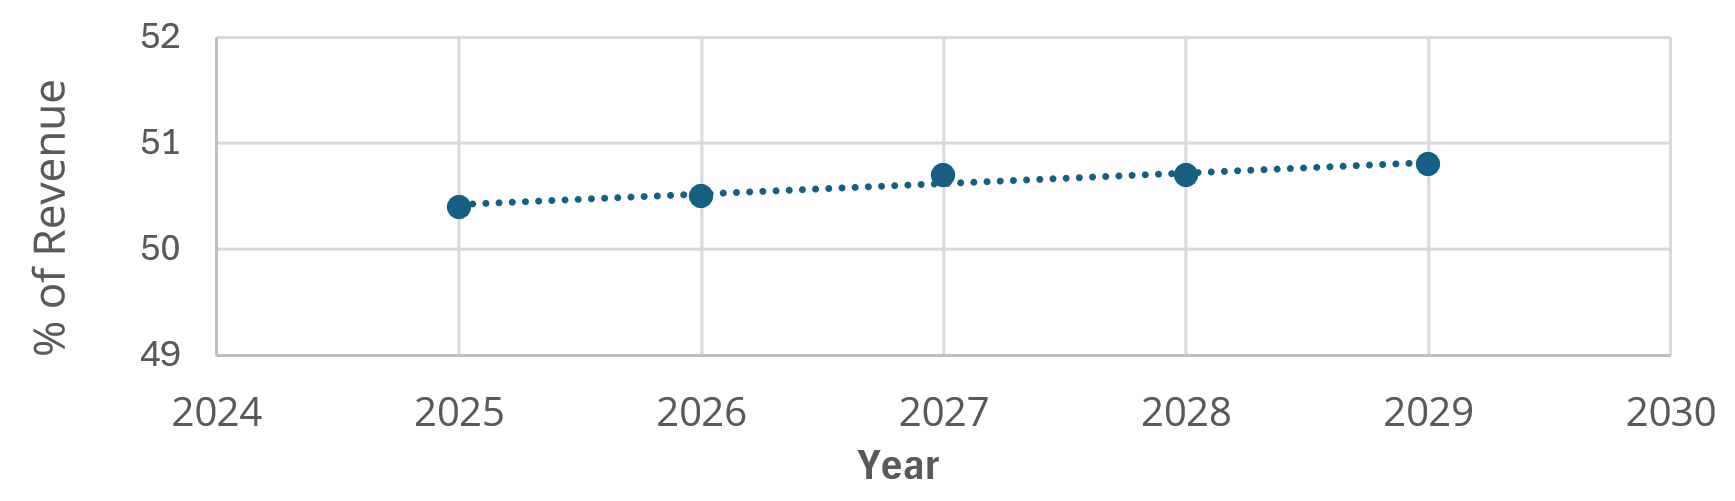
Industry Value Added (IVA) as a share of Revenue
The Poirier Group | Benchmarking Tool
Note: This data is derived from Canada-based Warehousing and Storage firms. For more specific reporting or further metrics, contact us below.
The Poirier Group | Benchmarking Tool The Poirier Group | Benchmarking Tool
Canada
The Poirier Group | Benchmarking Tool The Poirier Group | Benchmarking Tool
USA
Interested in customized benchmarking for your business needs?
Contact Our Subject Matter Experts
The Poirier Group | Benchmarking Tool

Let's Chat